An industrial power plant at sunset

Mapping the Electrical Distribution System

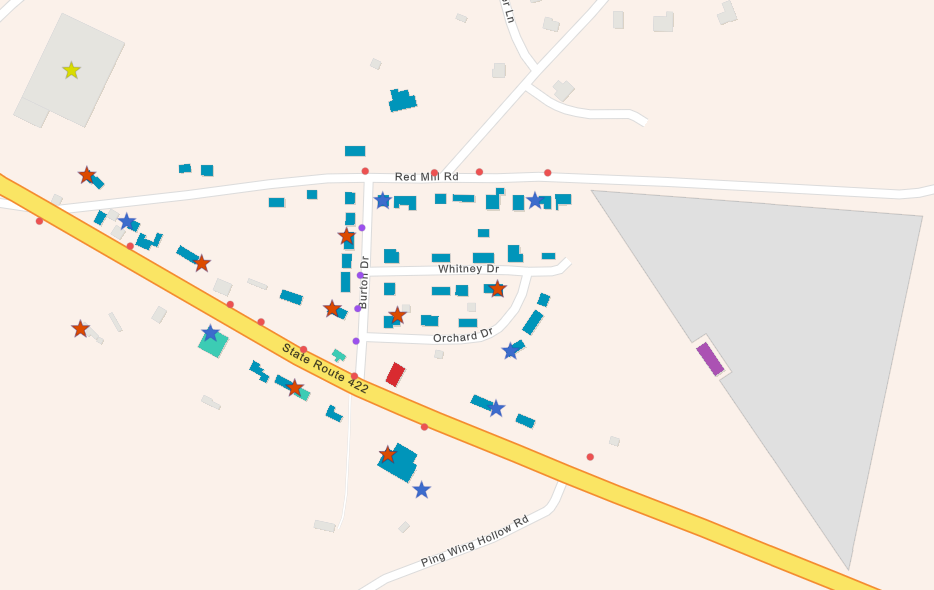
The electrical distribution system on a campus or in a district can be quite complicated, with lots of feeders and switchgear operating at various voltages. Much of the equipment may be located inside buildings, making it difficult for electrical maintenance and operations personnel to easily locate. This article will focus on the electrical distribution system on the fictional campus of Orchard College, shown in Figure 1.

Mapping the Electrical Distribution System

Figure 1 – Orchard College (Fictional Campus)

The mapping of the campus or district electrical distribution system provides a graphical representation for the visualization and management of electrical systems and equipment within various buildings and structures.

Effective Mapping

For effective use on a tablet or computer, the system mapping should be created to be interactive. An interactive map is built on an aerial view of the campus or district and is developed using software that enables optimal online access, thus making it easy for maintenance personnel to locate specific equipment.

An interactive map generally includes the following:

  • Substations
  • Switchgear
  • Campus/District Buildings
  • Circuits
  • Any number of additional locations may be included, such as:
    • Power Plants
    • Solar Fields
    • Emergency Diesel Generators
    • Crew Office(s)

Figure 2 shows a map and legend. Different types of buildings are located, as well as the locations of major electrical distribution equipment, such as substations and switchgear (LC for Load Center and DC for Distribution Center). A satellite view could be used instead.

Mapping the Electrical Distribution System

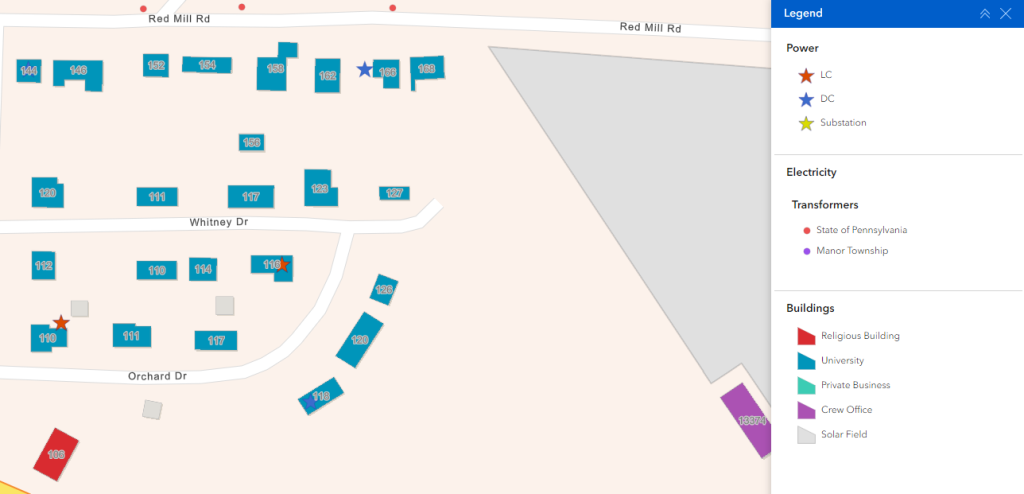
Figure 2 – Sample Campus Map with Legend

When any of the above is selected to be highlighted, specific information is provided, such as:

  • Address
  • Brief functional description
  • Representative exterior photo of the building or facility
  • Photos of equipment
  • List of incoming and outgoing voltages
  • Source of power feed (circuit number with source switchgear and/or transformer)
  • Single-line diagrams
  • Switchgear diagrams showing bays, main feeds, and bus ties

An example of a selected building is shown in Figure 3. An example of a selected switchgear is shown in Figure 4. In both examples, this information shown is merely typical; any desired information may be included.

Mapping the Electrical Distribution System

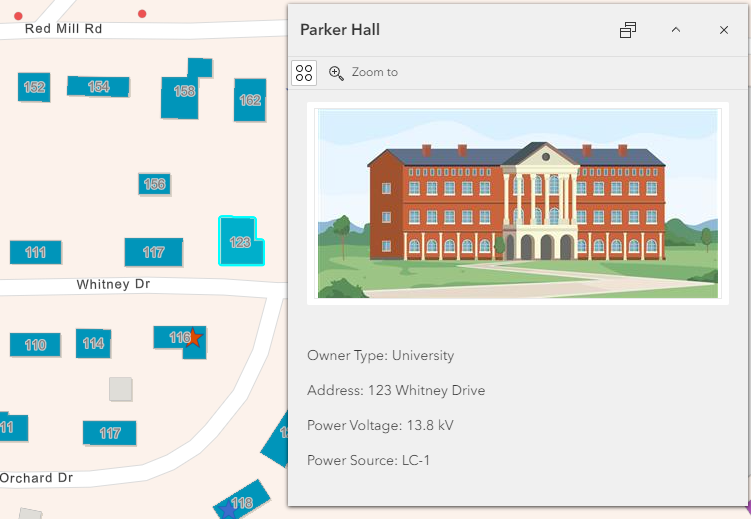
Figure 3 – Building 123 Selected, Parker Hall

Mapping the Electrical Distribution System

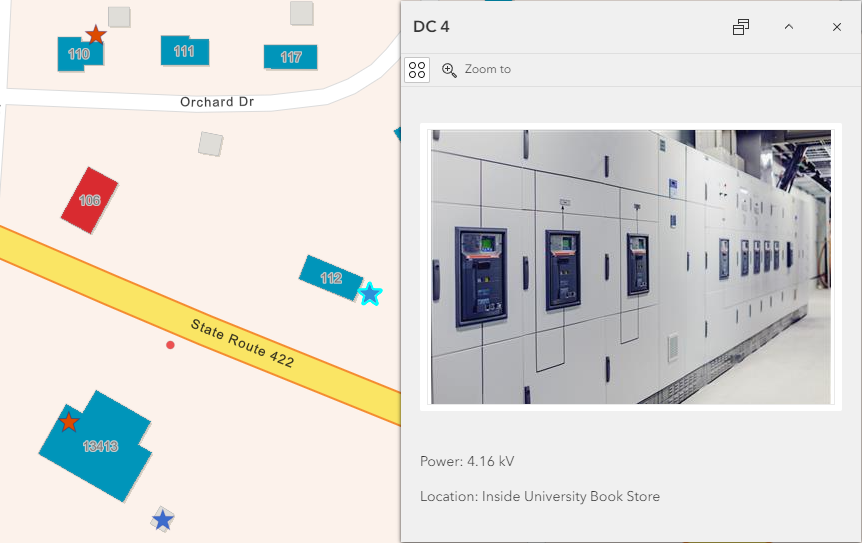
Figure 4 – Distribution Center DC4 Selected

A complete and robust system map provides a useful reference for maintenance and operations personnel to view electrical feeds to the campus buildings, including the supplying switchgear and circuit breaker. An interactive map of the electrical distribution system can be invaluable for electrical maintenance personnel in numerous ways.

Interactive Maps

Interactive Maps can help in:

  • Routine Maintenance and Operations: Electrical distribution systems have extensive infrastructure, including power lines, transformers, substations, switchgear, and more. Sending a crew to a specific piece of equipment for maintenance or operations can prove to be time-consuming if the exact location and nature of the equipment are unfamiliar to the crew personnel. Mapping software can help these personnel quickly locate and access every piece of equipment on the system.
  • Training and Education: Interactive maps can help newly hired personnel quickly learn about the scope and layout of the electrical distribution system.
  • Asset Management: Mapping software can help keep track of the extensive infrastructure assets, allowing for them to be efficiently managed for maintenance, upgrades, and expansions.
  • Outage Management: During power outages, mapping software can be used to pinpoint affected areas and dispatch repair crews more effectively. Real-time updates can help keep customers and users informed about the status of outages and estimated restoration times.
  • Planning and Optimization: By overlaying demographic data, terrain information, and historical usage patterns onto maps, personnel can better plan where to expand the infrastructure to meet growing demand or optimize existing networks for efficiency.
  • Vegetation Management: Trees and other vegetation near power lines can pose a risk of outages during storms or high winds. Mapping software can assist in identifying areas where vegetation management is needed to reduce this risk.
  • Customer Service: Mapping software can provide the tools to better serve the electrical customers. For example, customers can use interactive maps to report issues such as downed power lines or streetlight outages, allowing repair crews to respond more quickly.
  • Grid Modernization: As electric grids evolve with the integration of renewable energy sources, energy storage systems, and smart grid technologies, mapping software can help in the planning and implementation of these changes effectively.

Conclusion

Overall, mapping software provides electrical maintenance and operations personnel with the information they need to operate efficiently. It may also help improve reliability. It will also meet the evolving needs of its customers and regulatory requirements. Where pen and paper were once sufficient, now software provides clarity and precision that can mean the difference between a functioning system and a potential hazard. As digitalization permeates every aspect of life, embracing these technologies becomes not just advantageous, but necessary.

Previous Blogs

Renewable Energy Integration into District Energy Systems

Understanding VARs (without using math)

MWh Generation Cost Factors