
Graphic software, style, and usage have changed over the past few decades. It is important that facilities adapt and continually update graphics to enhance learning and provide more efficient training. Although there is a cost with improving training graphics, that cost is often offset with faster training/qualification of new people, shortened training sessions, and fewer unplanned shutdowns as operators will better understand their equipment.
When it comes to graphics, they all have some level of fidelity.
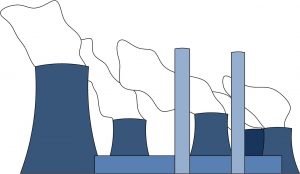

As you can see in the photos above, low fidelity graphics have much less detail than high fidelity graphics. Both types of graphics have attributes that make them suitable for supplementing training materials.
Low fidelity graphics are often used when something more complicated is explained. See the graphics below to see how flow diagrams and simple drawings showcase complex concepts.
Examples:
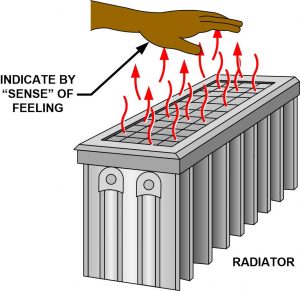
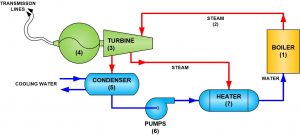
By taking away extra, unnecessary details like backgrounds, extra piping, and more, the learner can easily focus on the elements that are being explained in a particular part of the training.
Lack of detail doesn’t need to mean a lack of color. Low Fidelity graphics can use colors to their advantage. As you can see in the flow diagram and simple drawing above, red is used to indicate heat without actually using the word, although “steam” is a good indicator of heat. In the flow diagram, system components are color-coordinated to showcase different steps throughout the system.
High Fidelity graphics are great for straightforward explanations.
Example:
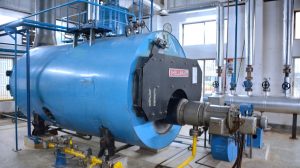
Above is a photo of a Shellmax boiler. Photos are high fidelity because no amount of detail has been removed.

Furthermore, using low fidelity elements such as simple arrows to represent things like steam flow, helps to foster a better understanding of the system and components.
Flow diagrams, simple drawings, and callouts just scratch the surface of graphics that FCS offers. It offers a range of fidelity graphics based on the complexity of the component or system and the learner’s needs.
FCS takes care to gather photos of the plant they are training for and provide callouts that show what the learner will actually encounter.
To learn more about the graphics and expertise FCS has to offer, contact us to talk about your plant’s training needs!